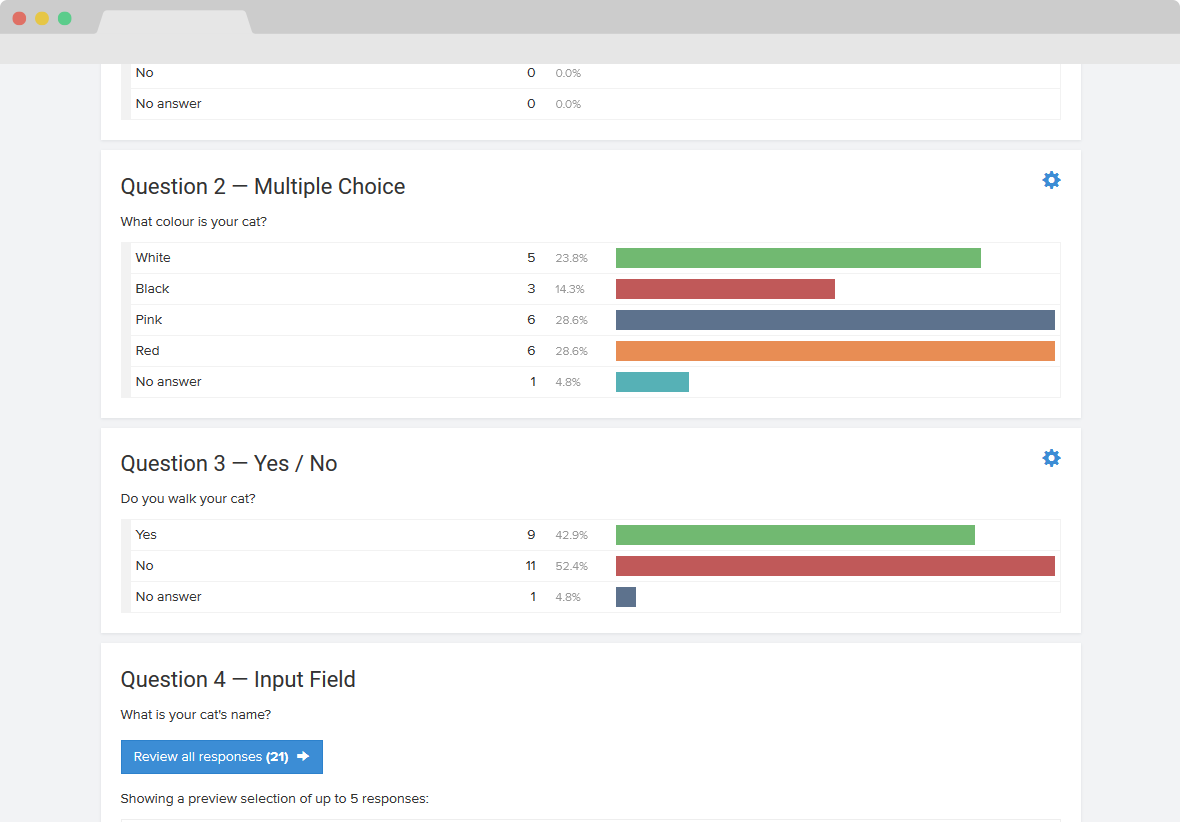
Table view.
All the reporting you're used to.
None of the cost.
For years, we’ve overpaid for crappy and overly-complicated survey products. Then we got FourEyes. We love it!
Andrew Wilkinson, Founder of Metalab and Flow
This survey builder is amazing. I love the click-to-expand and how easy is to drop in questions and rearrange them later.
Benjamin Fox, Co-founder of Tapstream
Very slick. The UI is clean and easy to use off the bat. Enough so that I played with it for a few minutes and wanted to see the rest too.
Jason Morehouse, Co-founder & CEO of Checkfront
I played around with the builder for 5 minutes straight -- it's pretty amazing! I really like how easy it is to use FourEyes.
Ben Seaman, CEO of Eartheasy
Y'know how some "free" surveys and trials limit reporting to a CSV export? That sucks. You deserve much better than that.
Visual Report
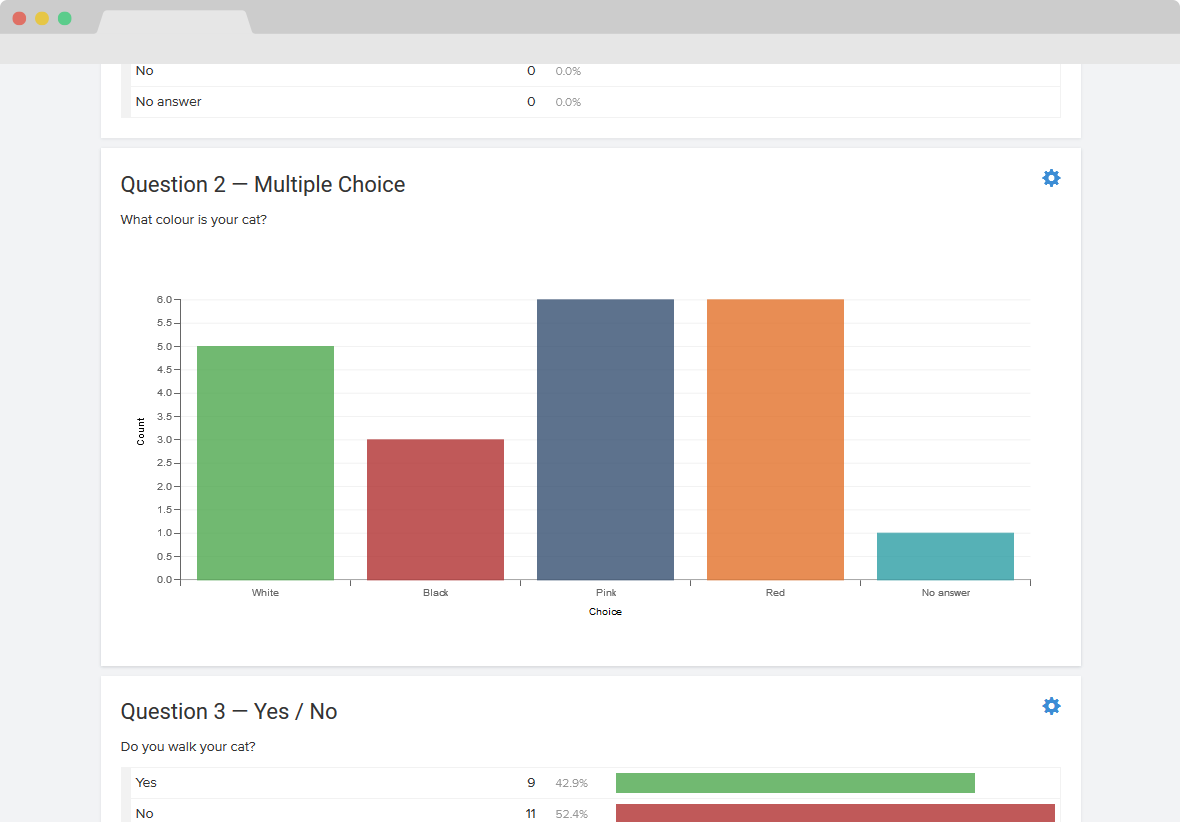
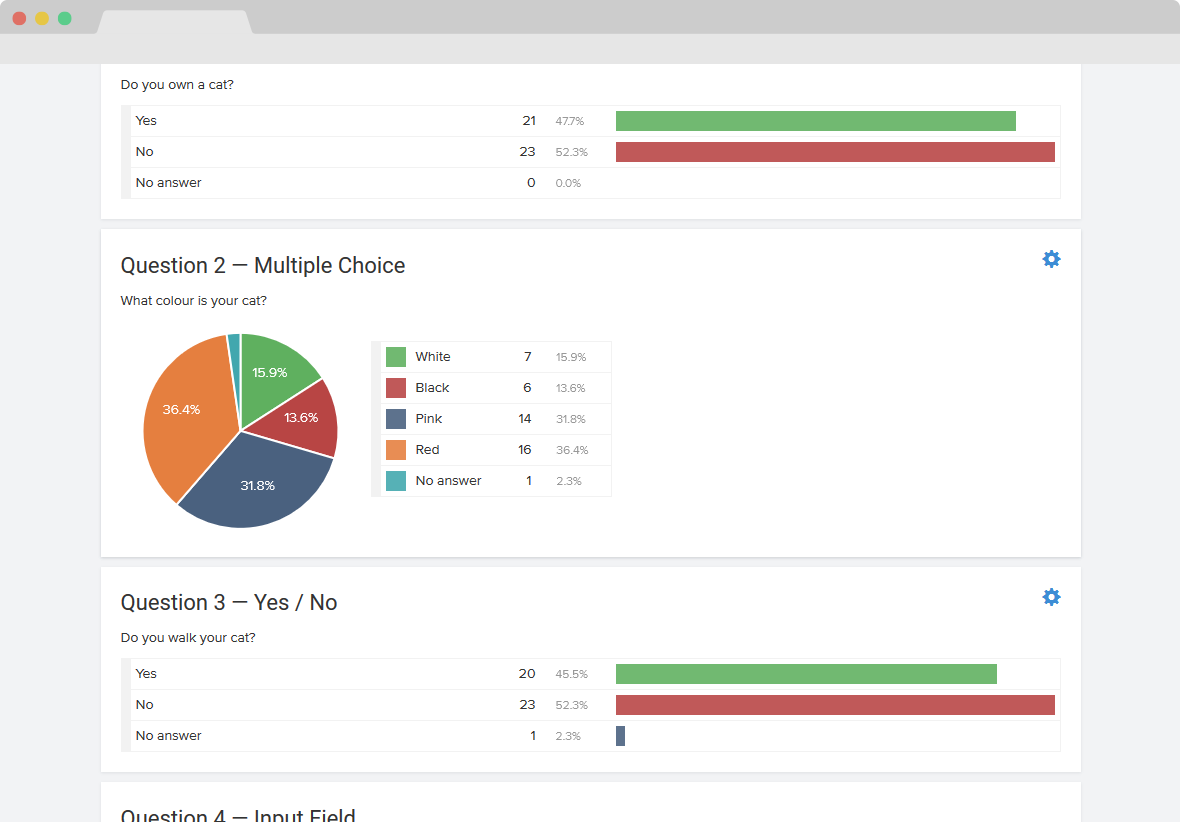
Make sense of the responses to each question - at a glance - by converting your data into a visual report.
Choose from a table view, bar chart, stacked bar or pie chart. The clean visuals give you exactly what you need to beef up your analysis and add instant meaning to PPT slides.
Plus, toggle on/off "no answer". Get previews of written responses, or see them all, and match respondents to the questions they answered.
Dig into your data.
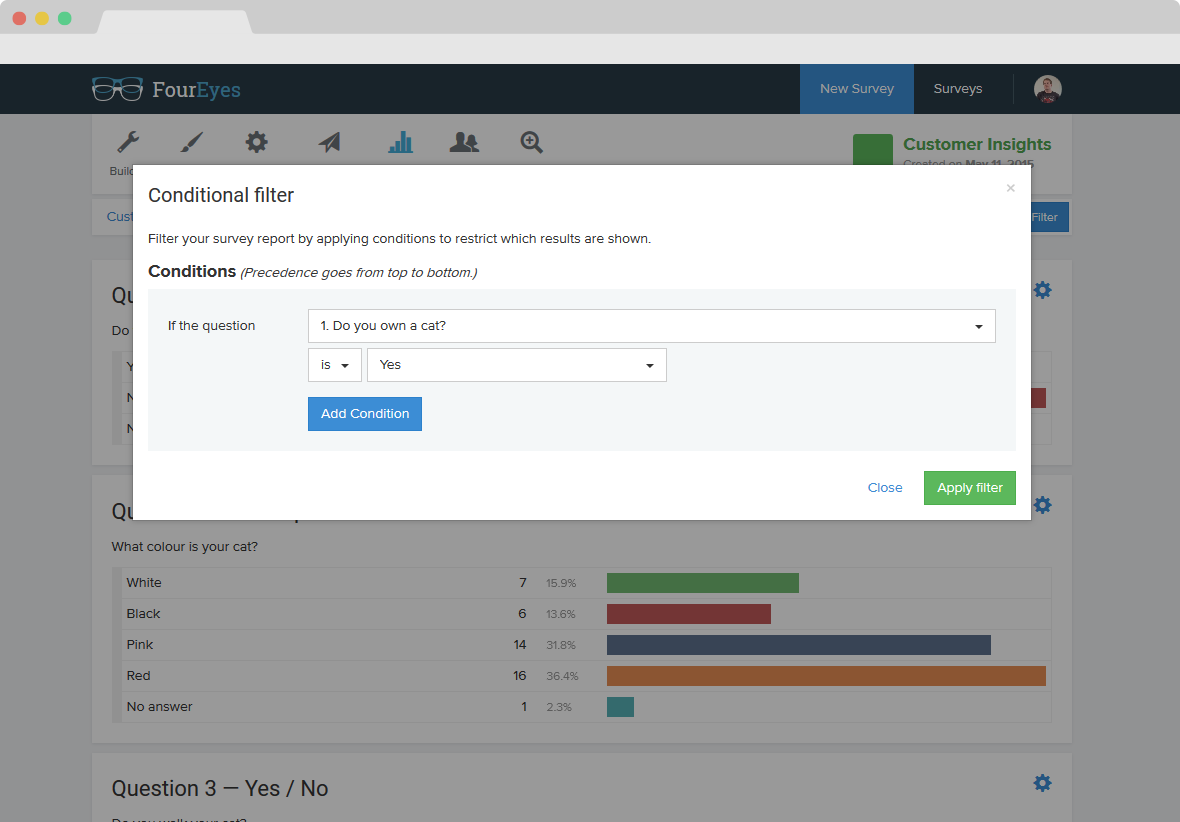
Wanna see charts only for a subset of your respondents, like those who answered No to a question? Apply conditions with a click to filter out irrelevant data.
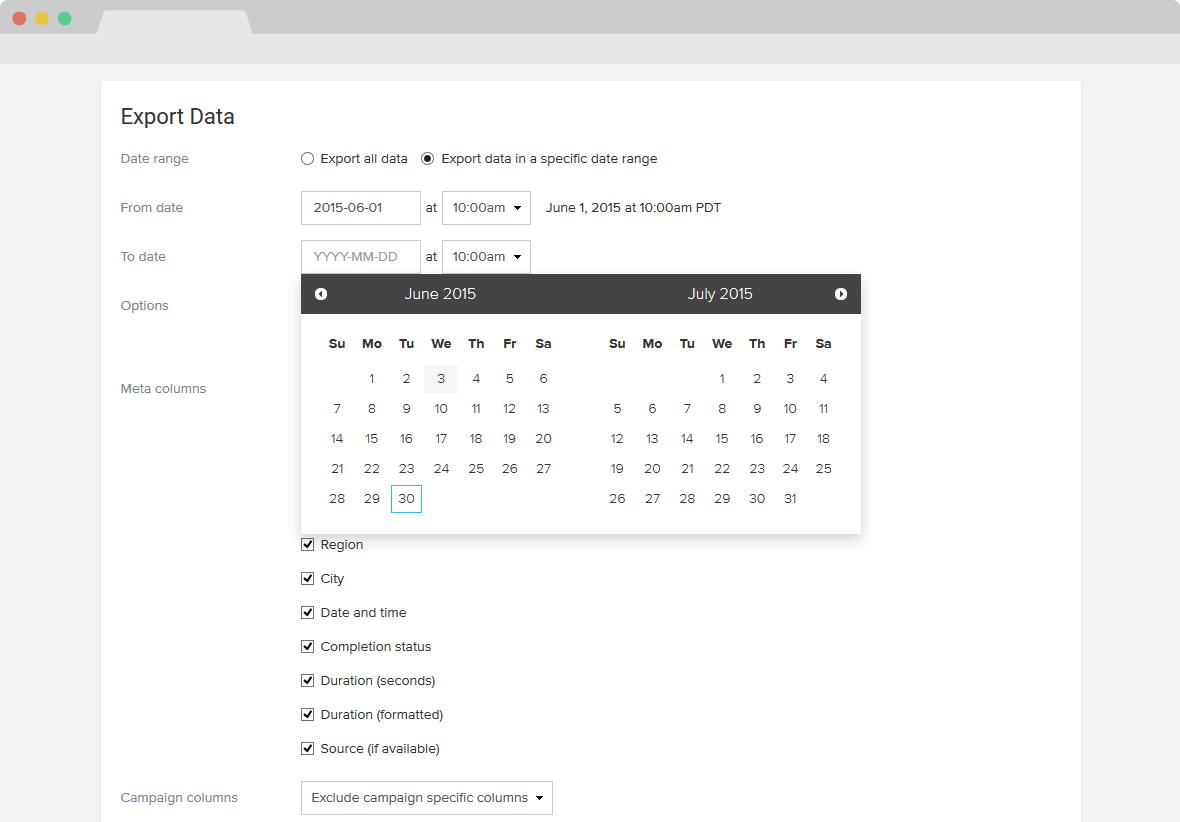
Export to Excel
Slice and dice the data however you see fit by exporting your responses to Excel.
Import into SPSS
Statistician at heart... or got that title on your business card? Then you'll dig that you can import your data into SPSS.
Include/Exclude select data
Before exporting, add or remove data about your respondents. Or download only responses to the questions you choose.